I have one million watercolor sets at home. I don’t know why since I never really ever painted with watercolor. But I keep thinking I want to try it and I keep buying sets that someone says is awesome. I finally plucked a set of Dr. Ph. Martin’s watercolors off the shelf and decided to play around with them. I figured the best way to start was to create a watercolor mixing chart to see what the colors looked like and how they mix between them.
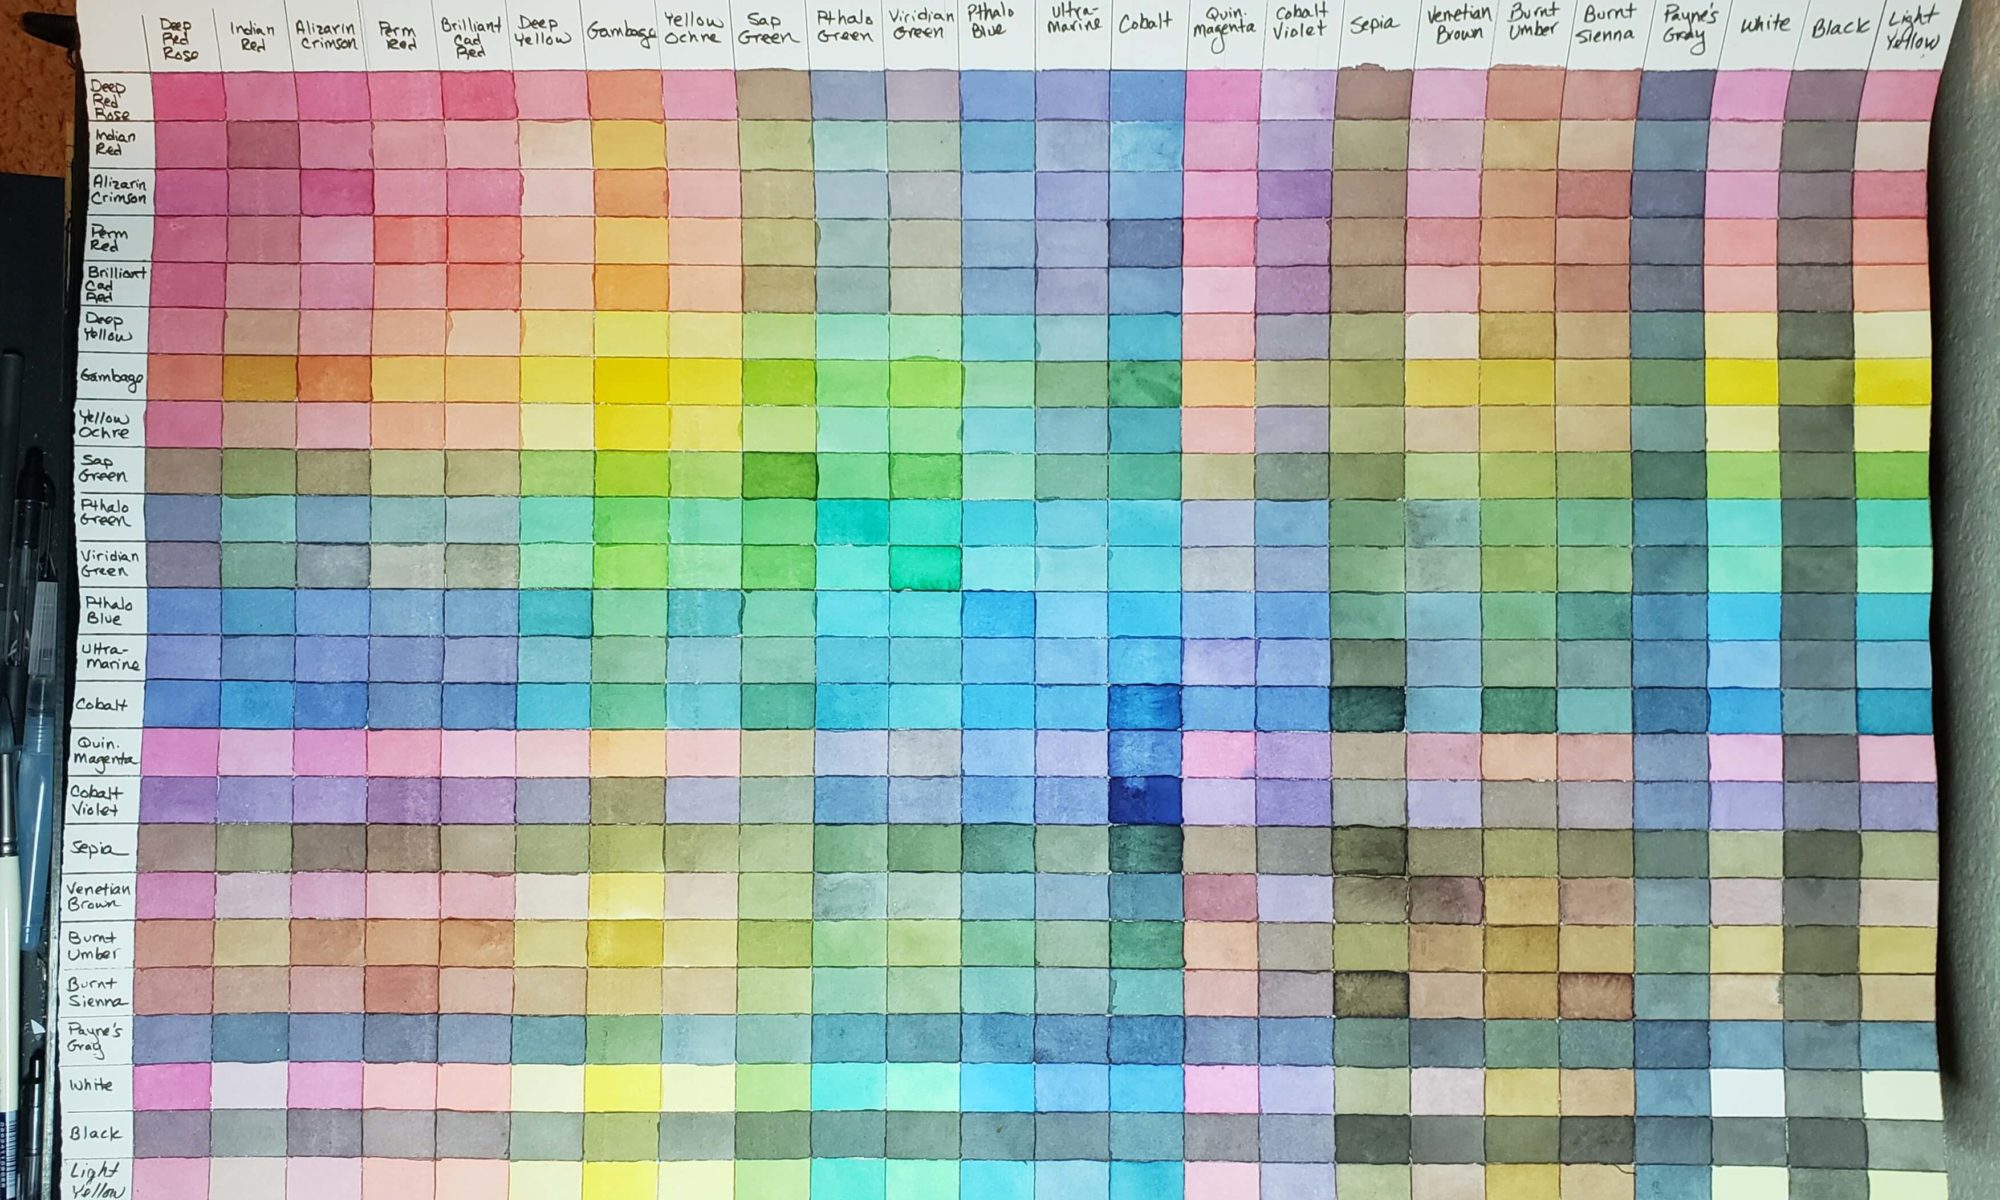
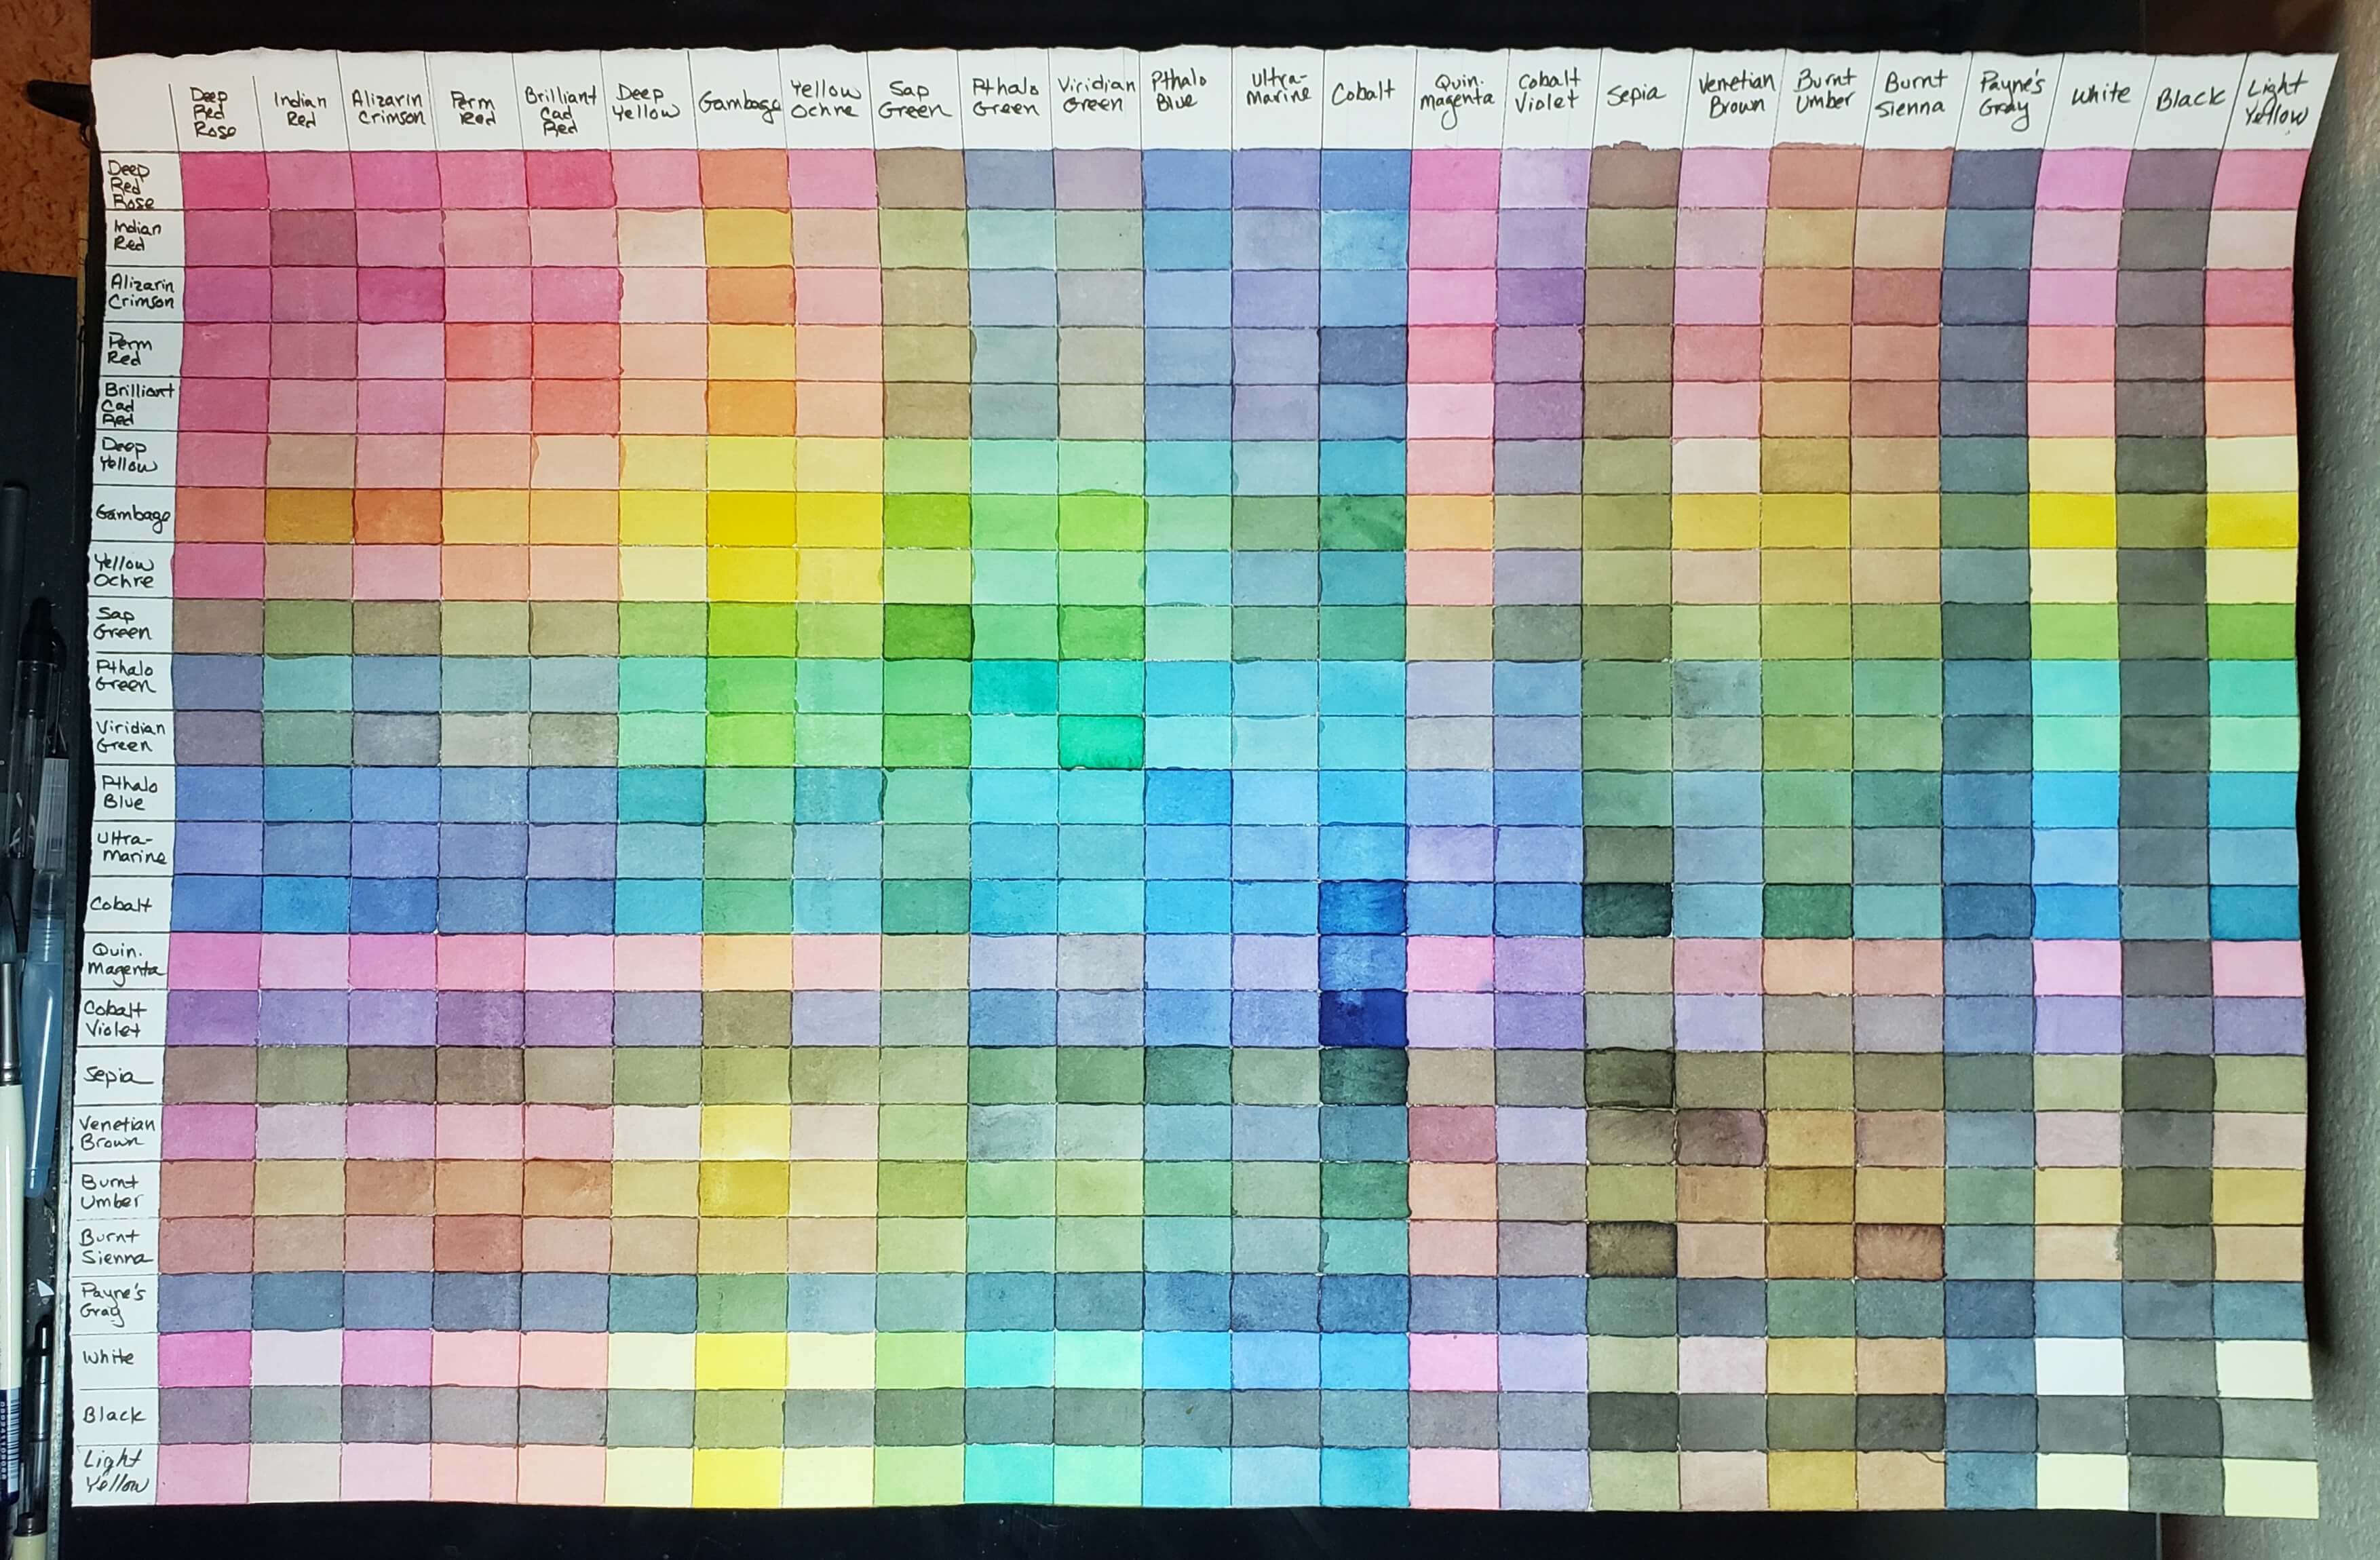
These watercolors come in sets of 12. Currently, there are three sets (36 colors) but I think when I bought them they only had two… or my local store didn’t know there was a third set. The chart above only covers the first two sets and I’m somewhat grateful I didn’t know there was a third set when I made this because it took me several weeks to mix all these combinations and make this chart.
Here are the three sets:
- Dr. Ph. Martin’s Hydrus Fine Art Watercolor (Set 1)
- Dr. Ph. Martin’s Hydrus Fine Art Watercolor (Set 2)
- Dr. Ph. Martin’s Hydrus Fine Art Watercolor (Set 3)
What drew me to these sets was that these come in liquid form with an eyedropper lid. When it comes to making a mixing chart, this is ideal since each color is easily reproducible. Through some experimentation I found that 1 drop of color to 10 drops of water gave a nice medium saturation of color. This is the ratio I used for the chart above.
I ordered a large poster frame to hang this up. Now, I’m just playing the waiting game for some inspiration on what to paint with these.
Wow! I’m very impressed with this chart and you’re actually completing the entire thing. Now, if only I knew how to use them.
Yeah, I almost tossed it out a few times while making it. It was a huge pain and I won’t be doing that again.
I’ll be trying some paintings, I just haven’t had any inspiration on what to paint yet.
Thanks for making this chart! I appreciate it!
How to use: pick your fav three colors or two and paint stripes on your paper. Let dry and enjoy the wonder and grace of watercolors!